You have probably visited the screen before if you have changed the wifi password or any other settings on your shub. If it is in router mode you need to go to
http://192.168.0.1 and if it is in modem mode go to
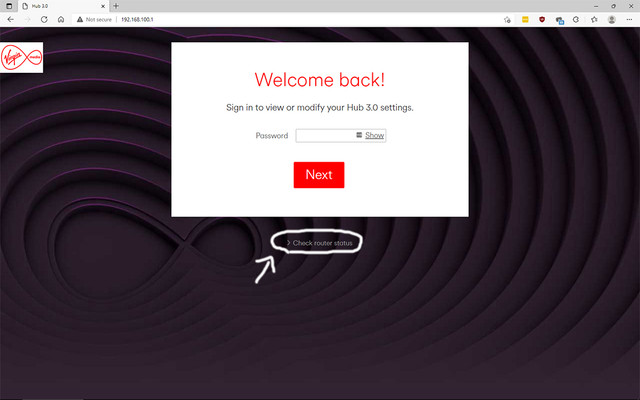
http://192.168.100.1 and you'll get this screen:
Don't log into the gui for the shub, it will take you to a load of settings which we don't need and aren't interested in. Instead, click on router status which will take you to a diagnostics screen.
Without getting overly complicated there is a signal that comes down your cable from Virgin Media and it has to be of a certain quality/signal strength and power in order for it to work properly. Sometimes the transmit power coming down the line can be too low or too high or there can be noise on the line. All of these things can cause varying degrees of problems ranging from slow downloads, patchy connectivity or complete loss of service.
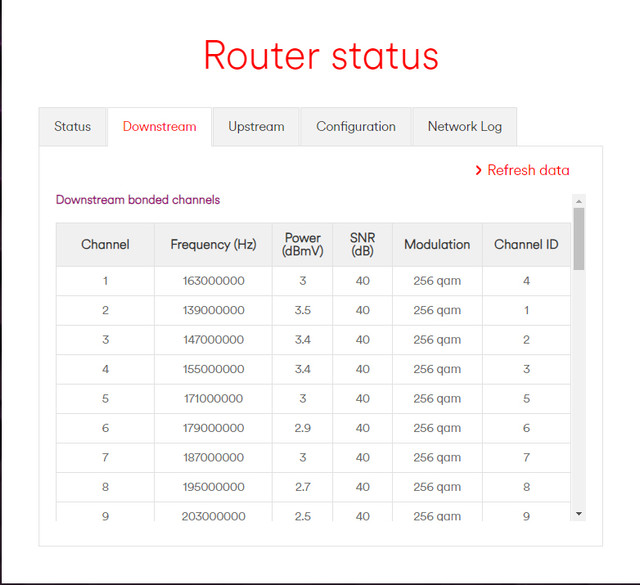
The first tab we need to look at is the downstream tab and the two columns we are looking for are the power and rs errors.
The tab is divided into 2 tables. The first table is all about power and noise and you want to be looking at the third and fourth columns. I know it might not make sense to you but the power levels for each channel want to be as close to 0 as possible and the acceptable range is something like -7 to +10 but they really are the limits. The minimum for SNR is 33. For reference the data displayed in the table below is well within spec and there are no issues.
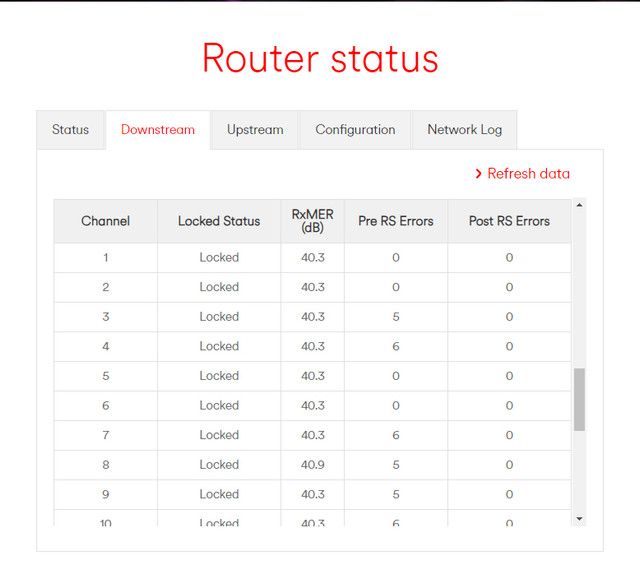
The second part of the table is about detectable errors. Pre RS errors is data which is corrupted in transit to your shub and the shub tries to fix it before forwarding it to the client on your network. The fewer the better but to be honest you'll always have some. The thing which we need to look at and what you should be concerned about are Post RS Errors. This is the corrupted data which the shub can't fix and has to be retransmitted. If for example everything was corrupted and had to be retransmitted then everything would essentially be having to be sent twice which means you are only downloading half the volume of data (half speed) you would normally do within a set time period. For reference, the table indicates everything is pretty much perfect. Very few Pre RS Errors and no Post RS Errors on any channel. You will see some tables with hundreds (literally) of Pre RS Errors on each channel but as long as this does not translate to Post RS Errors it is okay.
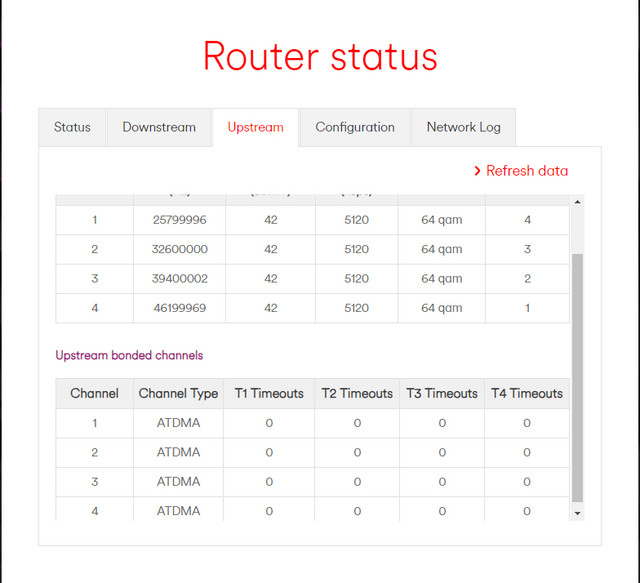
The next tab is the upstream tab. The three things we need to look at are the third and fifth columns and the Tx timeouts in the second table. I haven't included the column headers but the third column is all about power and this is really important when it comes to your upstream connection. I don't think yours will be an issue because your speed test ran at full speed. The fifth column is a sort of indication of the quality of your connection and if you have any channel which is running at less than 64 qam (32 or 16) then there is noise on the line. The bottom table features four columns and any errors in those columns can indicate a fault either with the shub or higher up the network on Virgin Media's end. For reference, the data displayed in this screenshot is perfect and there are no issues.
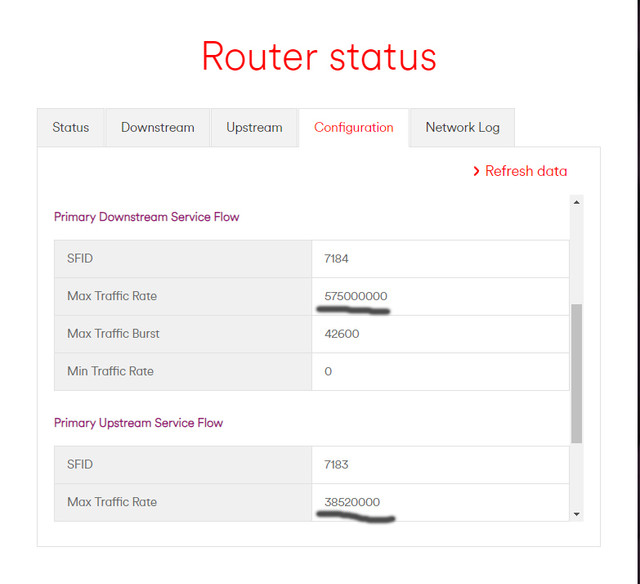
The next tab is the config tab and contains a lot of technical information with regards to how the shub is sending data. This is inconsequential to you however I have highlighted two interesting bits of information that are always good to keep an eye on. The max traffic rates are the speeds Virgin Media are telling the shub to do and is basically what you are subscribed to on your account. The speeds are always slightly higher than the advertised tier to ensure you can achieve that speed. I don't know what the provisioned speed is for 100mbits but as an example you should see something like 110mbits down and 11mbits up. The reason why those numbers are so long is because it is displayed in bits and not megabits. If you ever upgrade your package to e.g. 200mbits this should always be your first point of call to ensure the shub has been updated and received the config file for the new tier.
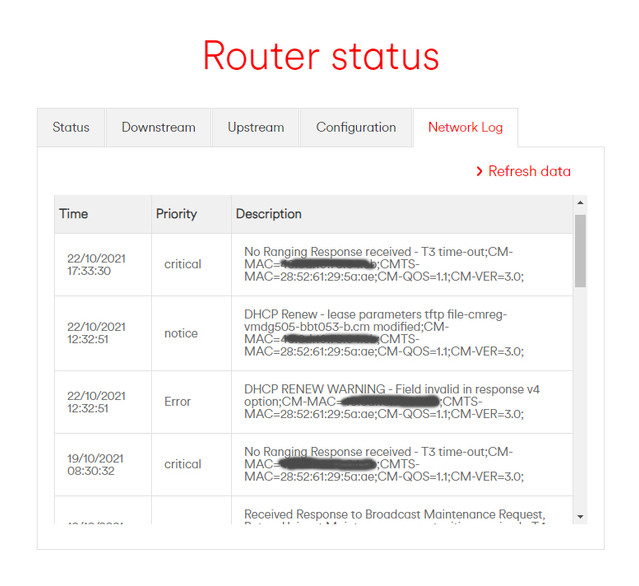
The last tab is the network log tab. This can be very handy as it will log errors when the shub attempts to connect to the network or reconnect if the connection fails. The presence of an entry, even if it is marked critical, is not indicative of a major fault. As an example. the shub will routinely request a new ip address and dhcp renewal and if the cmts (server VM's end) doesn't respond within a set time period the shub will throw a fit and log it as an error. It isn't a problem because the shub will keep trying until the server responds and this usually happens within seconds and is transparent to the user.
I know that was a bit long winded but I wanted to explain a few things and not just tell you to look at x, y and z without understanding what you are doing.
So, your job now is to click on router status, go into the downstream tab and check your downstream power and if you are getting any post rs errors. Go into the upstream tab and look at the upstream power, you are on 64 qam and if there are any timeouts. Lastly take a look at the log tab and see if there are any abnormal entries.
You now need to post that information here for us all to see and you can do that by way of screenshots like I have so all the information is at hand in case we have any follow up questions and it saves a lot of forum posts with questions and responses. If you can't do that just type the information and say your downstream power levels are all around +5 for example.
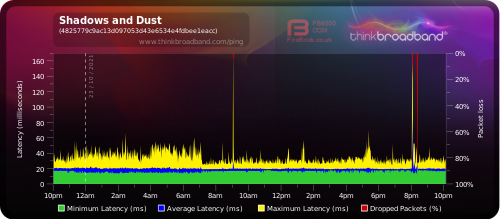
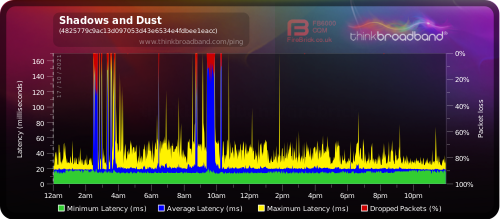
One other thing you can consider is setting up an Broadband Quality Monitor. It is a service which is run remotely and sends pings to your shub. Your pc or any device on your network does not need to be left on for it to work. It is a service which is run continuously 24/7 and if you are having any connectivity or speed issues it should be your first point of call.
There isn't anything wrong with the graph above and you would only need to be concerned if you start seeing chunks of blue and red on the graph. At that point you would then take a look at your power levels etc and see if there is a noticeable problem with your connection which would be causing the delay or packet loss seen on the graph.
I highly recommend you set one up regardless because you never know when you are going to need it. It is a free service and requires no administering or maintenance. Check it out here:
https://www.thinkbroadband.com/broad...toring/quality
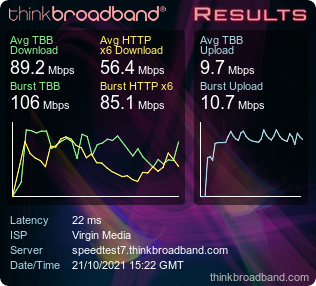
No connection runs at 100% 24/7 and there may be times in the evenings or weekends when you may not get your max download speed. The nature of cable technology (HFC) means there is a finite amount of bandwidth/speed available to your street and your area and if lots of people are all online at the same time then that speed has to be shared between that number of users which means that sometimes you will achieve less than max speed. If you get half speed as one off, it is annoying but just may be indicative of a congested network. I would only be concerned if it was happening all the time and especially day in day out. Have you ran another speed test since? Even though it is Saturday evening I have ran several speed tests while creating this post and I have got full speed each time on both downstream and upstream so it is always worth retesting to determine whether there is an actual fault and ascertain its duration (which the graph can help with).
 Join CF


 You can check your service status and that fault reference by signing into your account or clicking here:

