Quote:
Originally Posted by jfman

Im surprised we dont have something using population wide data by now breaking down cases, hospitalisations and deaths by age tracking back to the start of vaccinations. All of these figures will be reducing due to lockdown but a nice graph should show a clear and increasing effect of the vaccine in older age groups compared to the population as a whole.
|
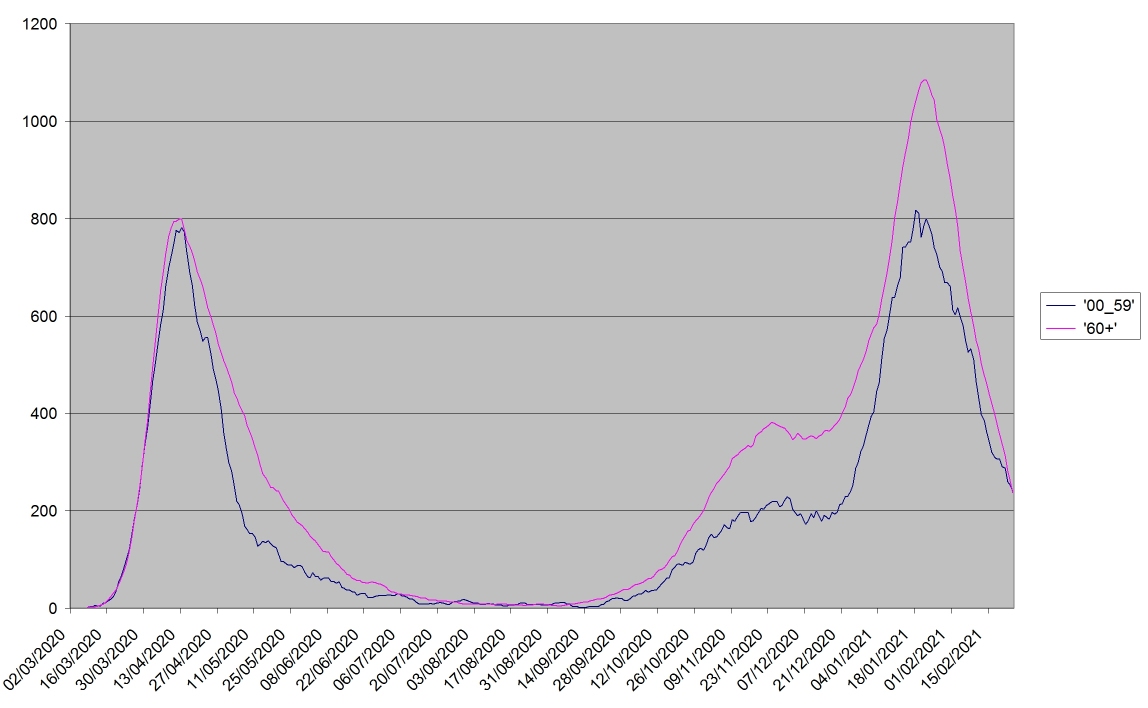
Here you go. This is daily deaths in England for under and over-60s (data from ONS). I've scaled the 0-59 graph by a factor of 10 to make them roughly the same height. You'd expect the over 60s to be better at complying with the lockdowns so any difference isn't entirely due to vaccines. However in the first spike the over-60s deaths came down slower than the under-60. This time the over-60s are coming down quicker.